

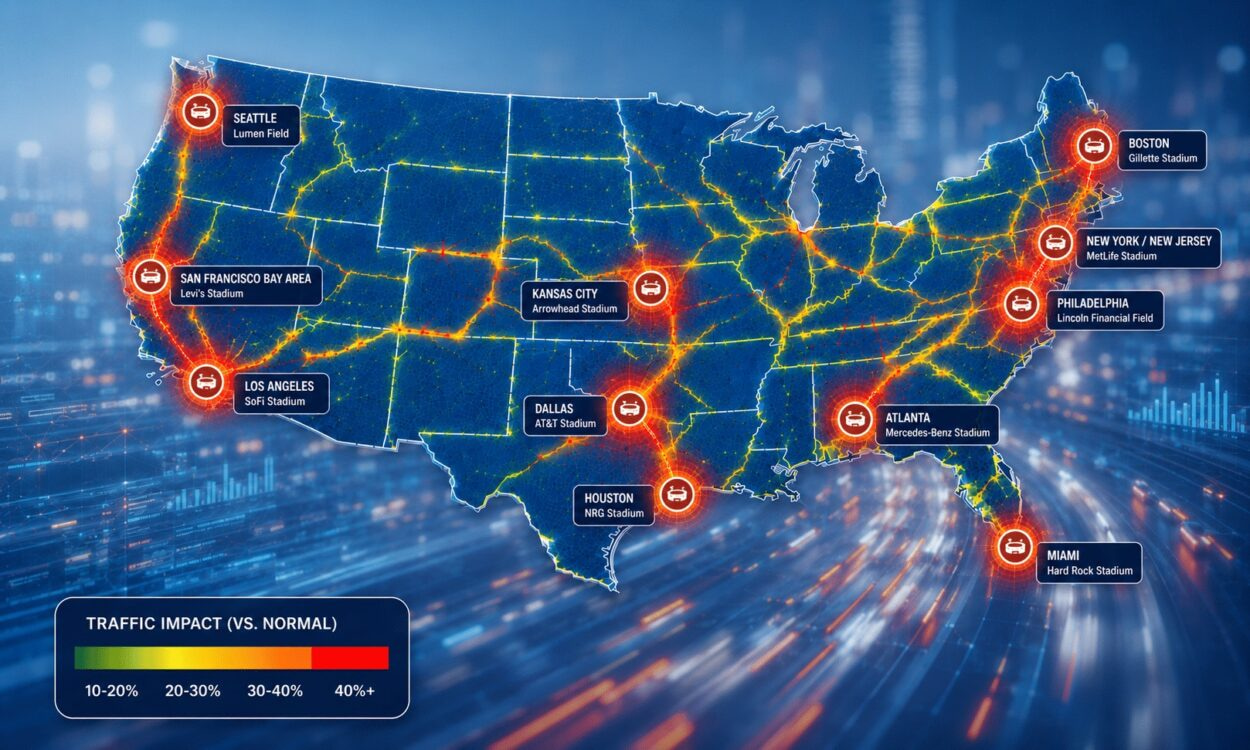
The 2026 FIFA World Cup spans 16 cities across the United States, Canada, and Mexico, making it the most geographically diverse World Cup in history. With matches across 11 U.S. stadiums attracting millions of fans from around the world, transportation demands vary as widely as the cities themselves. INRIX states it is uniquely positioned to capture that complexity at scale with unprecedented speed, backed by a data infrastructure no other company can beat.
How INRIX Tracks World Cup Traffic
Drawing on more than 300 million connected vehicles and devices, a 50-petabyte transportation data lake, and 44 billion data points generated daily, INRIX can analyze traffic conditions around any U.S. stadium within hours of a match. The company compares event-day speeds against historical baselines, pinpoints corridor bottlenecks, and benchmarks World Cup impacts against other major events at the same venues, giving the public a real-time view of how World Cup travel behaves across multiple U.S. metros at once.
Opening Weekend Congestion Spikes
Early data from the tournament's opening weekend confirmed significant congestion spikes before and after matches within one mile of the stadiums. Across Los Angeles, the San Francisco Bay Area, the New York/New Jersey area, Boston, Houston, Dallas, and Philadelphia, pre-game traffic speeds near some venues dropped nearly 50% below normal.
Following the opening matches of the 2026 FIFA World Cup, INRIX continued to monitor traffic conditions around host stadiums to understand how match-day travel patterns developed. After the first week of FIFA World Cup 2026 group-stage matches, INRIX continued monitoring traffic conditions around host stadiums.
The 2026 FIFA World Cup is being held at 11 U.S. stadiums between mid-June and mid-July 2026. Cities around these stadiums have seen transportation patterns shift as the tournament progresses.
The breadth of data we have access to lets us answer questions about transportation that others can't answer at this speed or scale. Beyond tracking vehicle speeds, we're analyzing signal performance, pedestrian and micromobility movement, multimodal comparisons across match types and cities, and how World Cup traffic stacks up against other major events at the same venues. That's what 20-plus years of proprietary mobility data enables.
Ahmed Darrat, Chief Product Officer at INRIX, outlined the scope of the company's analysis as the tournament continues.
Ongoing Tournament Coverage
INRIX will publish ongoing traffic analysis throughout the tournament, with multiple data drops per week as the World Cup progresses toward the July 19 final. The Data Hub provides ongoing match-by-match comparisons, delay reporting, and city-specific mobility insights for the duration of the event.
About INRIX
Founded in 2004, INRIX pioneered intelligent mobility solutions by transforming big data from connected devices and vehicles into mobility insights. INRIX has harnessed machine learning and artificial intelligence to deliver precise and actionable mobility data. This approach enabled INRIX to become one of the leading providers of data and analytics in people and vehicle movement. With partners and solutions spanning across the mobility ecosystem, INRIX is positioned at the intersection of technology and transportation.
Featured names
- Data Reveals
- Is Reshaping
- Traffic Across
- United States
- San Francisco
- Ahmed Darrat
- Chief Product
- Media Contact
- Lucy Meneghello
- Cities Bellevue